
Here's the problem with the bathroom scale and even BMI: they tell you how much you weigh, not what you're made of. The CDC notes that BMI doesn't directly measure body fat or tell you where it's located, which is why it's meant to be one piece of a larger health picture, not the whole story.
Body composition analysis fills that gap. It estimates how your weight splits between fat, muscle, water, and other tissue. This guide covers the main metrics, how to track trends, why testing conditions matter, and when it helps to have a professional walk through the results with you.
Key Takeaways
- Read your results as a group — one isolated number rarely tells the full story
- Track trends in fat mass, skeletal muscle, visceral fat, and segmental balance over weeks, not days
- Compare tests taken under similar conditions, since hydration, food, and exercise shift readings
- "Good" numbers depend on age, sex, goals, and the device used, not one universal chart
- Use your report to ask better questions, not to self-diagnose
What Is Body Composition Analysis?
Body composition analysis estimates how your total body weight divides between fat mass and fat-free mass, meaning muscle, water, minerals, and organs. That split is not what a standard scale reports.
A scale measures total mass. BMI adds your height into the equation, but it still can't tell fat from muscle. A bodybuilder and someone with a high body fat percentage could post the same BMI and look nothing alike on paper.
Several methods estimate body composition, including:
- Bioelectrical impedance analysis (BIA), including devices like InBody
- DEXA/DXA scans using X-ray imaging
- Skinfold calipers for manual pinch measurements
- Hydrostatic weighing through underwater density testing
These methods aren't interchangeable. A 2022 comparison of football players found meaningful differences between BIA, DXA, and skinfold body-fat estimates taken on the same people. That's a reminder to stick with one method when tracking your own progress.
How InBody-Style BIA Testing Works
BIA sends a low-level electrical current through your body and measures impedance, how much resistance the current meets as it travels through fat, muscle, and water. A 2025 scientific review of impedance devices confirms that fat and muscle figures are estimates calculated from these electrical measurements, not tissues the current physically counts.

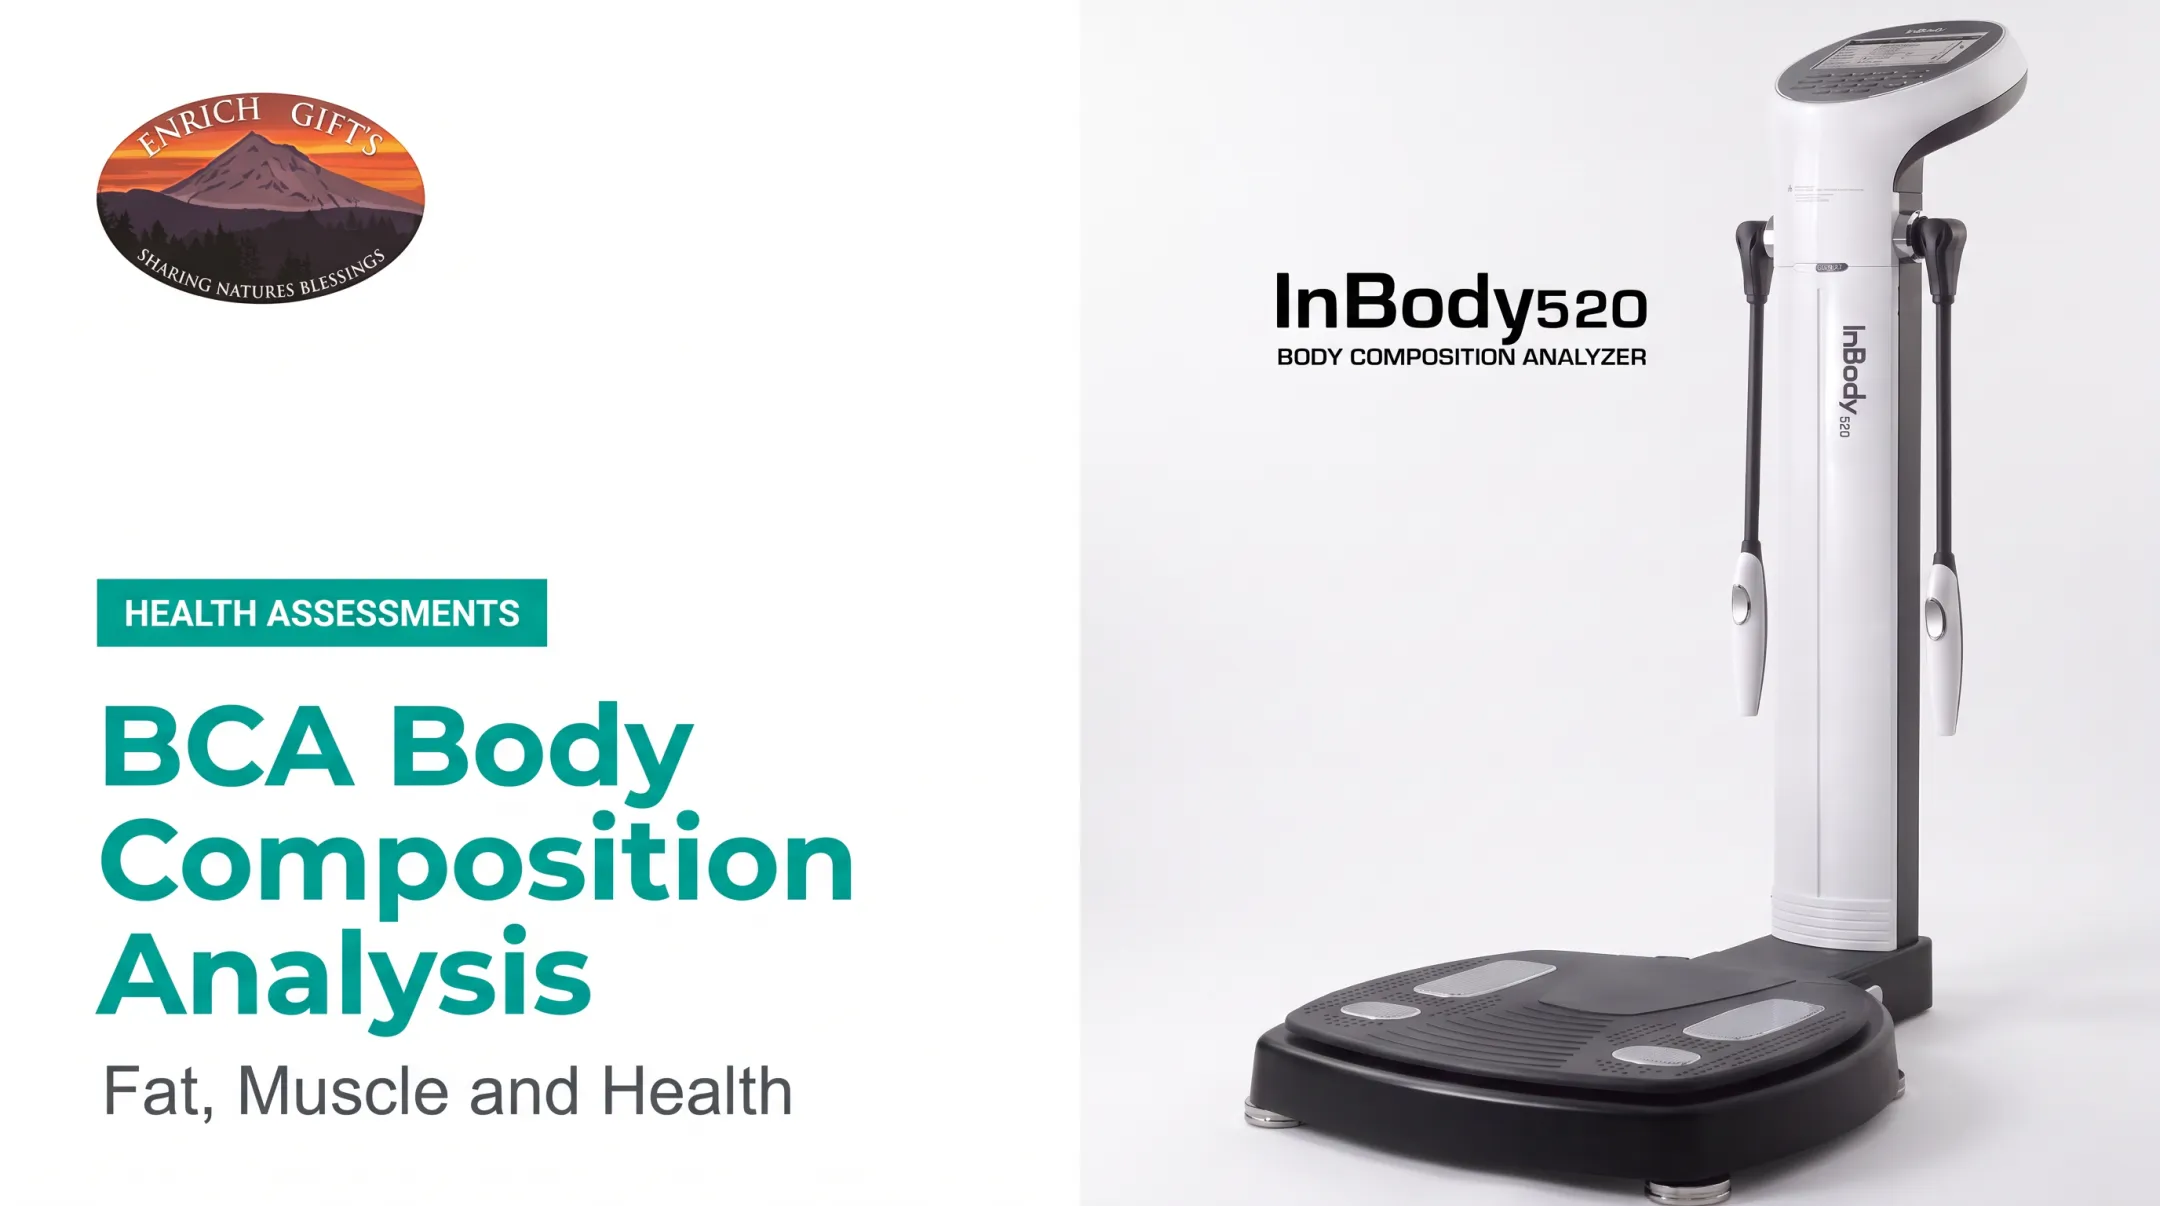
The InBody 520, for example, is built for segment-level estimates:
- Uses eight-point tactile electrodes
- Analyzes five segments: both arms, both legs, and the trunk
- Avoids age, gender, or athletic assumption inputs
- Completes a full scan in under 45 seconds
Different devices still use different frequencies, electrode setups, and prediction equations. Interpret your results with that specific report's reference ranges, not a number from another machine.
What a Typical Report Includes
Most BIA reports cover a similar set of categories, though not every analyzer includes all of them:
- Body composition breakdown (fat vs. fat-free mass)
- Muscle-fat analysis and body fat percentage
- Skeletal muscle mass
- Visceral fat indicators
- Segmental lean analysis (arms, legs, trunk)
- Total body water and water balance
- Basal metabolic rate (BMR)
The InBody 520 report, for instance, commonly includes:
- Total body water, lean body mass, and soft lean mass
- Skeletal muscle mass and body fat mass
- Percent body fat, BMI, and BMR
- Visceral fat level and the ECW/TBW ratio
Some values are equation-based estimates, not direct measurements. Treat them as informed approximations rather than lab-grade facts.
Why Body Composition Analysis Matters
A stable number on the scale can hide a lot. You might be losing fat and gaining muscle at the same time, with the net weight change landing near zero. Or your weight might be dropping while muscle mass drops right along with it, which usually isn't the goal.

Body composition data gives you (and anyone helping you interpret it) something more specific to work with than "weight went up" or "weight went down." It supports better questions about nutrition, resistance training, recovery, and overall wellness.
Practical uses include:
- Tracking whether weight change involves fat, lean mass, or both
- Spotting possible muscle imbalances through segmental data
- Monitoring trends during a structured fitness or wellness plan
- Creating a baseline for discussion with a qualified healthcare professional
Important caveat: body composition analysis doesn't diagnose disease. It isn't a replacement for medical evaluation, lab testing, or a clinician's assessment. Treat the results as context for decisions—not a medical conclusion.
How to Read Your Body Composition Analysis Results
Before comparing anything, confirm the basics:
- Test date and device used
- Units and reference ranges
- Same device under similar testing conditions
Mixing devices or wildly different conditions makes trend-spotting unreliable.
Step 1 – Start With Body Weight, Fat Mass, and Lean Mass
Total body weight, body fat mass, body fat percentage, fat-free mass, and lean body mass all answer slightly different questions. Percentages show proportion; absolute values show actual pounds or kilograms. Review both together.
One common mix-up: "lean" doesn't automatically mean muscle. Lean mass includes water, organs, and connective tissue alongside skeletal muscle. A shift in lean mass could reflect a hydration change as easily as a muscle change.
Step 2 – Review Skeletal Muscle Mass and Segmental Balance
Skeletal muscle mass refers specifically to the muscle attached to your skeleton, the tissue most relevant to strength and movement goals. Changes here matter more for body recomposition than total weight changes do.
Segmental analysis compares muscle distribution across your arms, legs, and trunk. Reference bars and labels vary by device, so treat an imbalance flag as a prompt for further investigation, not a standalone diagnosis.
Step 3 – Check Body Fat Distribution and Visceral Fat Indicators
Subcutaneous fat sits just beneath the skin. Visceral fat surrounds organs deeper in the abdominal cavity. The Framingham Heart Study analysis of over 3,000 adults found that both fat types were linked to metabolic risk factors, with visceral fat showing stronger associations for most measures. That's an association from research, not proof that any single BIA visceral-fat score diagnoses a condition.
Your analyzer's visceral fat level or area estimate should be interpreted using that device's own documentation. Avoid applying a threshold from one brand to a reading from another.
Step 4 – Interpret Body Water and Basal Metabolic Rate Carefully
Total body water splits into intracellular water (inside your cells) and extracellular water (outside your cells). The ECW/TBW ratio reflects that split. Hydration status on test day (dehydrated, post-exercise, or recently rehydrated) can shift this reading noticeably.
Basal metabolic rate (BMR) estimates the energy your body needs at rest. It's calculated from your lean body mass using a prediction equation, not measured directly. Don't use a printed BMR as a strict daily calorie target without factoring in activity level and professional guidance.
Step 5 – Compare Trends Rather Than One Reading
A single test is a snapshot. Record results over multiple sessions and look for consistent directional movement in fat mass, muscle mass, and segmental measures.
Small fluctuations may just be normal measurement variability. A published test-retest study of three InBody models found minimum detectable differences of roughly 2% to 2.7% body fat before a change could be considered beyond measurement error. In other words, a 0.5% shift probably isn't meaningful; a 3% shift across consistent testing conditions likely is.

Practical Example: Turning a Report Into a Question
Say your body weight barely moves over a month, but fat mass drops and skeletal muscle mass rises. First, check whether that shift exceeds your device's expected measurement variability.
If it holds up, turn it into action questions:
- Is your resistance training working?
- Is protein intake supporting the muscle gain?
- Should recovery or sleep change?
That's the real value of the data. It points you toward a specific conversation instead of a vague feeling that "something's working" or "nothing's changing."
Unexpected or concerning patterns deserve review by a qualified professional alongside your symptoms and health history.
Common Factors That Can Affect Your Results
BIA readings are sensitive to conditions at the time of testing. Being aware of these factors prevents misreading normal variation as a real change.
Things that can shift your numbers:
- Hydration status: dehydration or overhydration changes impedance readings
- Recent meals or drinks: even small amounts of food can skew results slightly
- Exercise: recent workouts shift fluid distribution
- Alcohol: affects hydration; avoid it for 24 hours before testing
- Skin temperature: cold skin alters impedance measurements
- Time of day and restroom use: both affect fluid balance
Best practice: Test at a similar time of day, under comparable pre-test conditions, every time. Morning testing before eating or exercising tends to be the most consistent. Repeating every 2 to 4 weeks gives trends room to show up without overreacting to daily noise.
If one result looks unusual, repeat the test or ask a qualified professional before drawing conclusions. One outlier reading isn't a pattern.
A few situations call for extra caution. Implanted electronic devices, pregnancy, and significant fluid shifts from certain health conditions may require avoiding BIA testing or checking with a professional first. The specific device's safety instructions should guide that decision, not a general rule of thumb.
How Enrich Gifts Can Help
Numbers on a printout only go so far without context. That's where personalized guidance comes in.
At Enrich Gifts, Dr. Carolyn Johansen uses InBody analysis as one piece of a broader naturopathic assessment, alongside tools like thermography, OligoScan, and cardiovascular and stress screening. She walks through the findings with you so you can understand what your body may be communicating.
Working one-on-one with Dr. Johansen can help you:
- Make sense of unfamiliar terms like ECW/TBW ratio or visceral fat level
- Identify which trends actually deserve attention versus normal fluctuation
- Build a wellness approach around your own pace, goals, and lifestyle
This isn't a diagnosis, and it doesn't replace conventional medical care. It's a way to connect the dots between your InBody results, your lifestyle, and your broader health picture.
Appointments are available through home visits or Zoom for clients in and around Arlington, Texas. Reach out to Enrich Gifts to learn about naturopathic consultations and functional assessment options.
Conclusion
Body composition analysis gives you a more detailed picture than weight alone ever could, bringing fat, lean tissue, muscle distribution, and water-related estimates into view together. None of those numbers mean much in isolation.
The real skill is reading the full report, comparing like with like, and following trends instead of chasing one perfect reading.
Put your results to work by:
- Reading fat, muscle, and water metrics together, not in isolation
- Comparing tests taken under similar conditions over time
- Bringing confusing or concerning numbers to a qualified healthcare professional
Personalized guidance turns raw data into next steps you can sustain. A practitioner who uses functional testing, including InBody analysis, can help you interpret the report and shape a plan around your lifestyle.
Frequently Asked Questions
How do I interpret my body composition analyzer results?
Review body fat percentage, fat mass, lean mass, skeletal muscle, visceral fat, and water together—not as isolated scores. Compare them with the device's reference ranges, and track trends across tests taken under similar conditions.
What are good body composition analyzer results?
Desirable results vary by age, sex, activity level, goals, and the specific device used. Overall trends and how you feel matter more than hitting one universal number.
What is a healthy body fat percentage (by age and sex)?
InBody's published general guidelines suggest roughly 8-25% for men and 16-32% for women, increasing somewhat with age. These are manufacturer guidelines, not a diagnosis or a personal prescription.
What is a healthy skeletal muscle mass percentage?
There's no single universal percentage across devices and populations, since equations and reference data differ by brand. Read skeletal muscle results against your analyzer's own framework, ideally with guidance from a qualified practitioner.
Is a body composition analysis worth it?
It's useful for establishing a baseline and tracking trends when done consistently under similar conditions. It has real limitations, though, and can't replace comprehensive medical assessment.
How long does it take to see results from a body composition analyzer (InBody)?
This depends on your plan and goals. Retesting every 2 to 4 weeks under consistent conditions gives trends enough time to show beyond normal day-to-day fluctuation.