
Two people can weigh exactly the same and have completely different health profiles. One might carry solid muscle and healthy hydration levels. The other might be quietly losing muscle while gaining fat, with the scale barely budging. The American Medical Association has gone on record stating that BMI loses its predictive value for individuals, since it doesn't directly measure fat or account for differences in body shape, age, and sex (AMA, 2023).
A one-on-one body composition assessment changes that equation. Instead of a single, misleading number, you get a detailed map of muscle, fat, and water, interpreted by someone trained to explain what it means for your life. This guide walks through the science, the key metrics, and how personalized guidance turns raw data into a plan you can actually use.
Key Takeaways
- BMI and scale weight miss muscle loss, fat distribution, and hydration status.
- Multi-frequency BIA checks five body segments separately for more precise readings.
- Visceral fat—not total weight alone—drives most metabolic and cardiovascular risk.
- One-on-one review turns raw printouts into clear priorities you can act on.
- Prep and consistent timing protect tracking accuracy between visits.
How Bioelectrical Impedance Analysis (BIA) Evaluates Internal Health
Bioelectrical impedance analysis works by sending a mild, imperceptible electrical current through the body and measuring the resistance it encounters. Muscle and water conduct electricity easily. Fat does not. By tracking how much the current slows down as it passes through different tissues, the device estimates how much of your body is water, muscle, and fat.
Fat and muscle aren't measured directly. They're estimated from how electricity moves through water-rich versus water-poor tissue (InBody USA). That is why device quality matters so much.
Medical-Grade Devices vs. Consumer Scales
Electrode design and body coverage drive how useful those estimates are.
- Consumer smart scales typically send current through the feet only, missing the arms and trunk entirely.
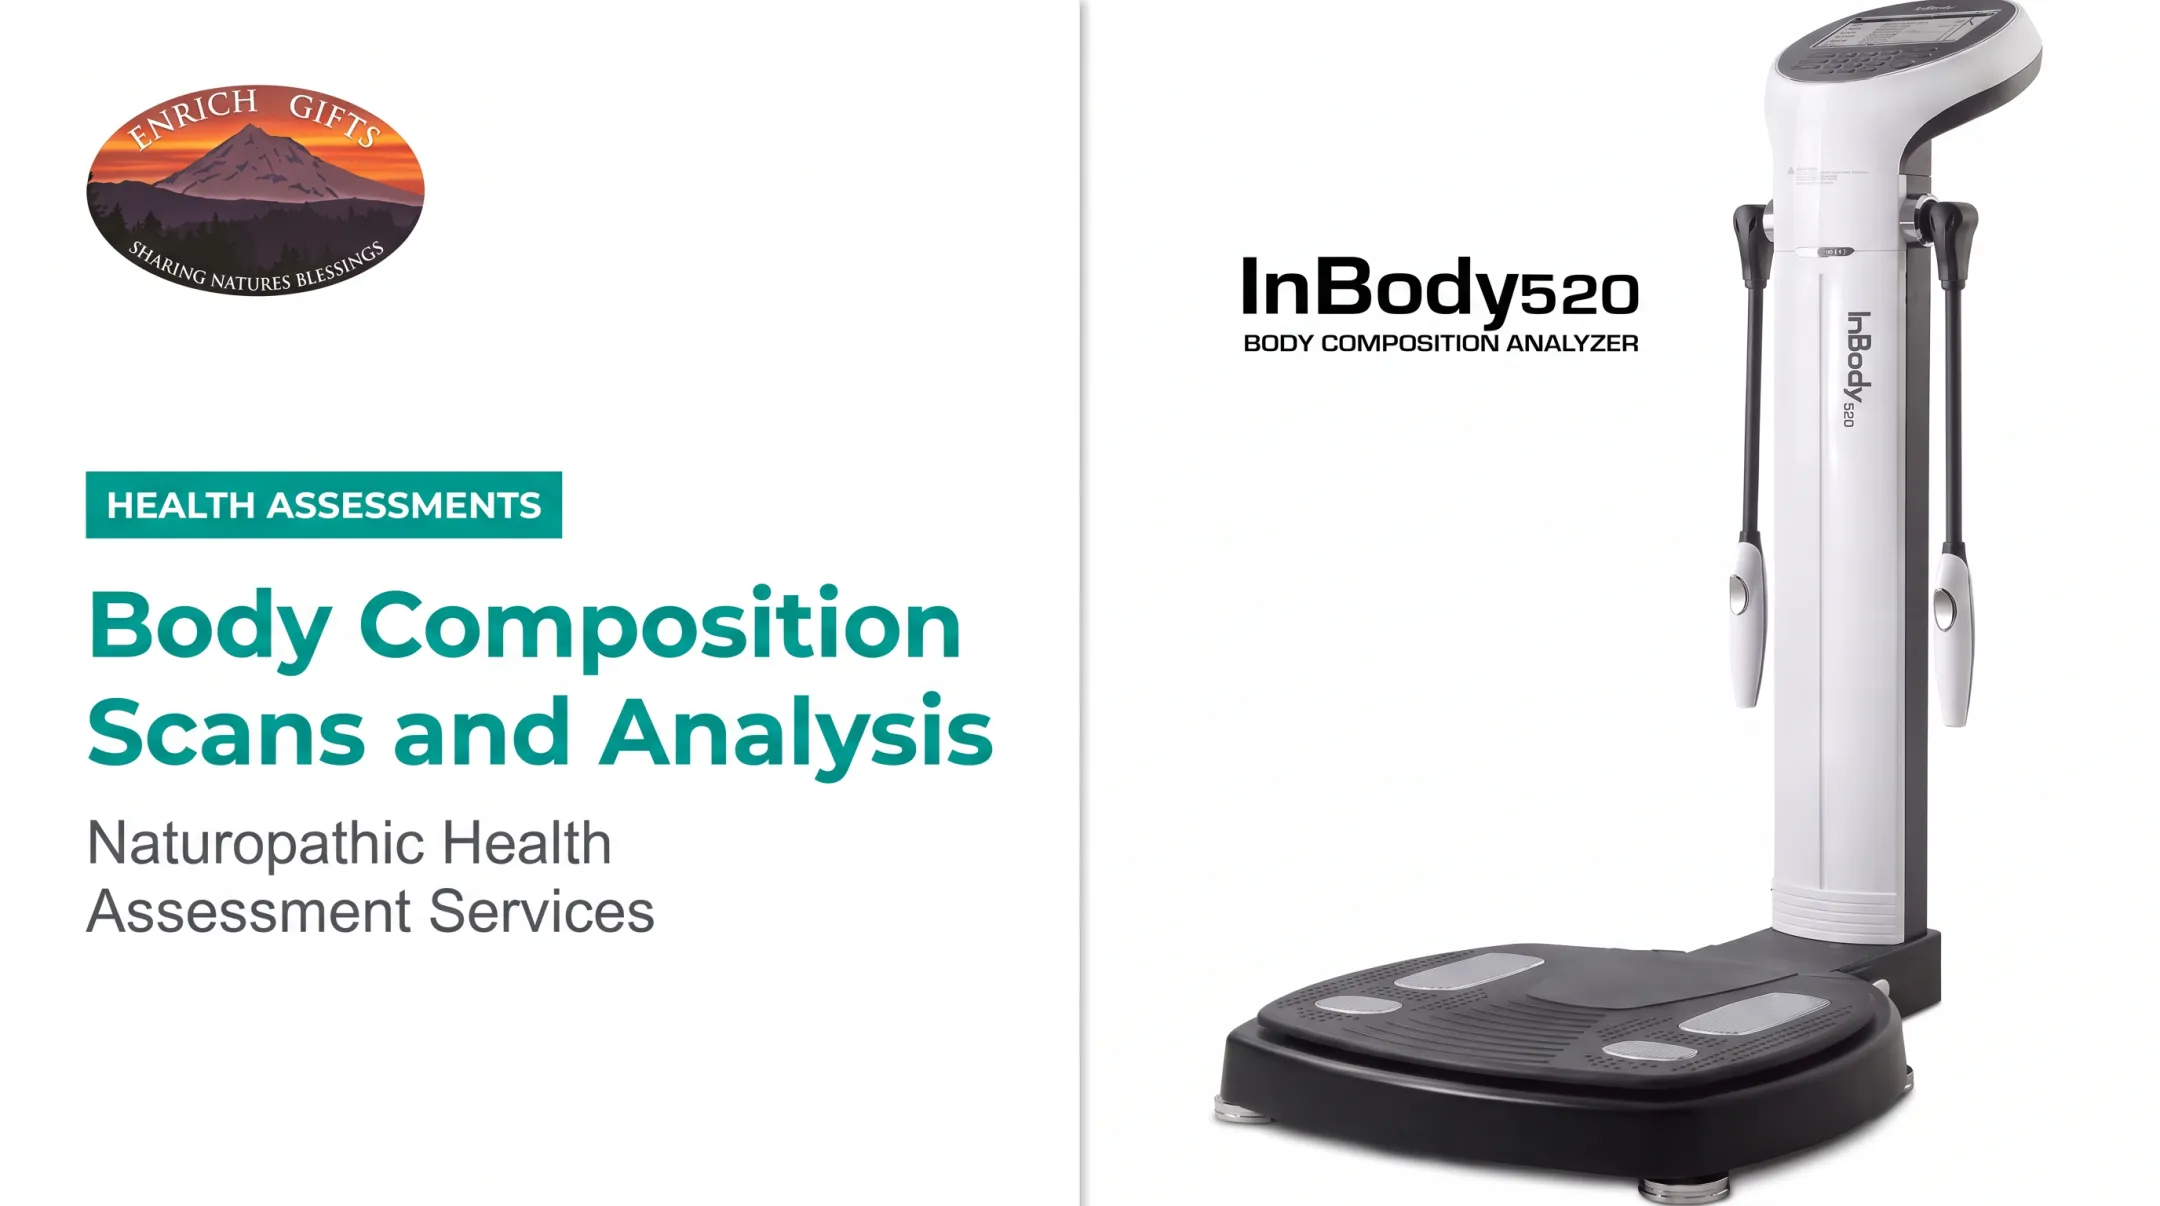
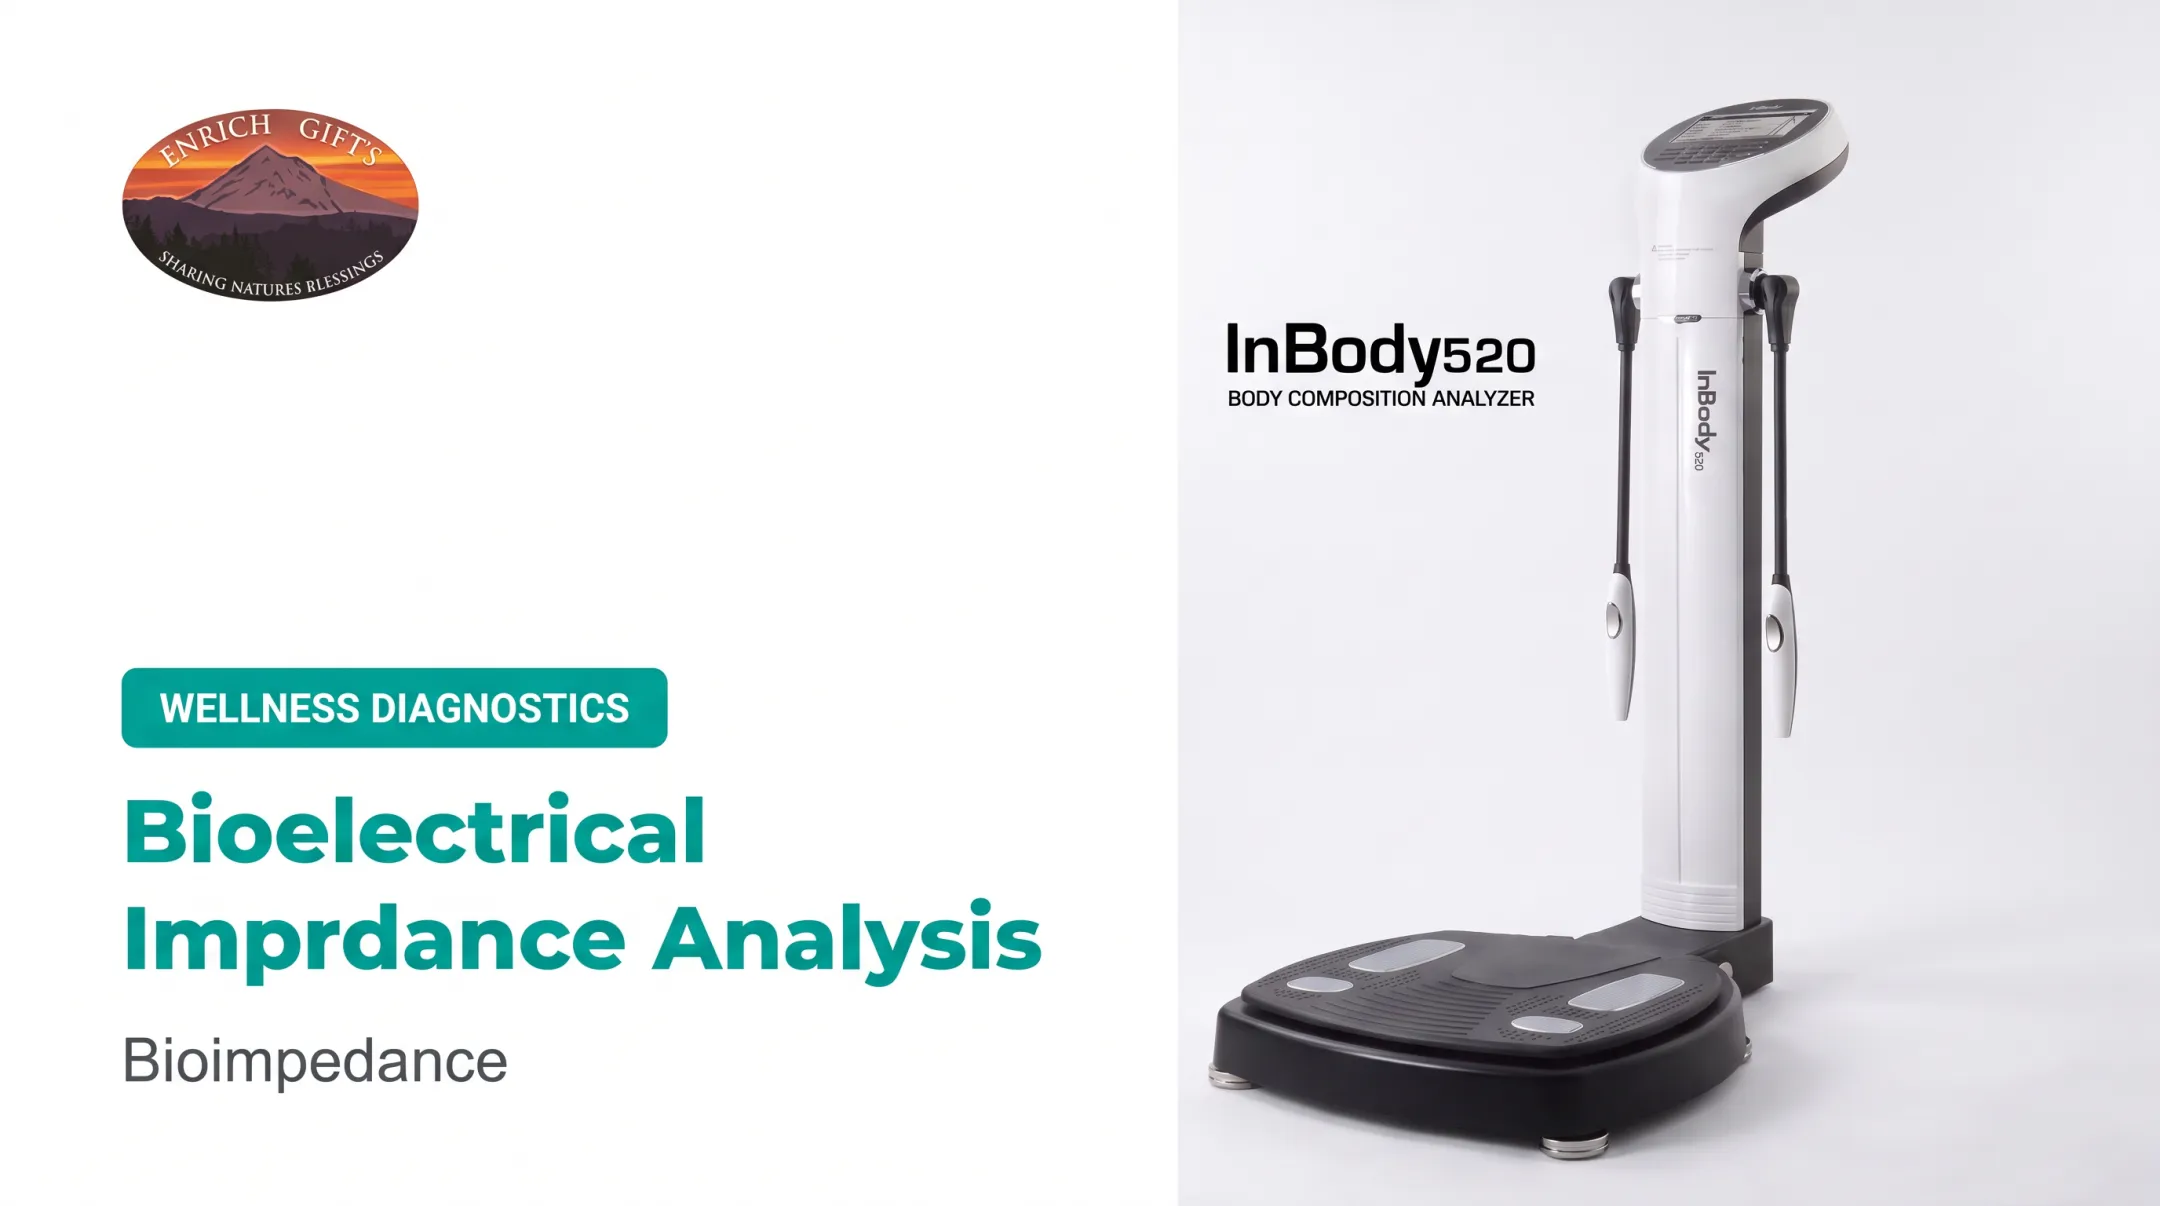
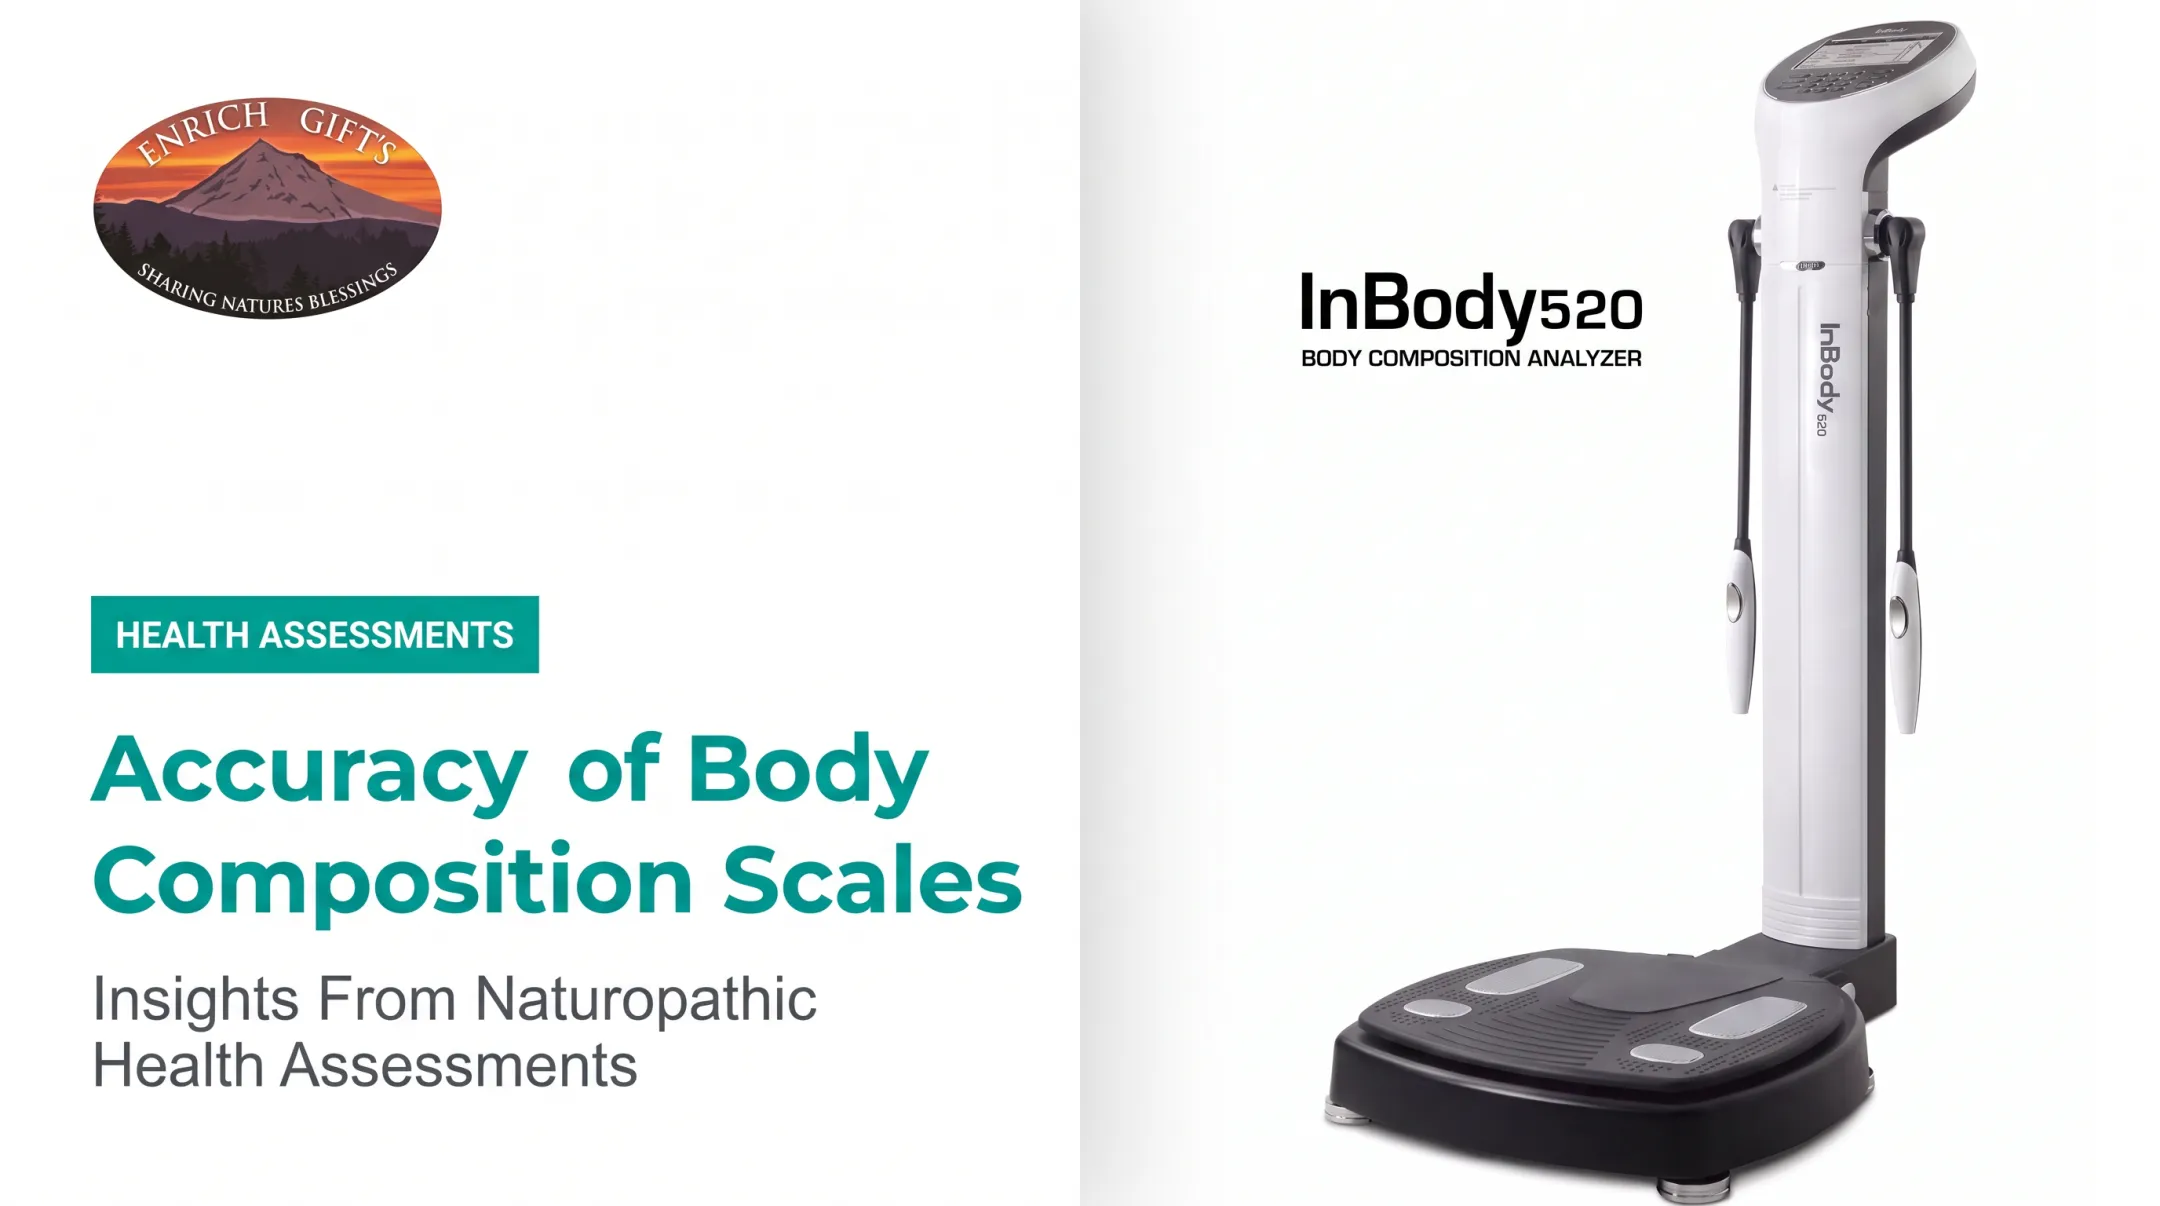
- Professional multi-frequency analyzers, like the InBody 520 used at Enrich Gifts, apply eight-point tactile electrodes and analyze five segments independently: both arms, both legs, and the torso.
Segmental analysis means a smart scale can't tell you if your left leg carries less muscle than your right. A professional device can.

How Reliable Is It, Really?
Research backs up the repeatability of medical-grade BIA. A controlled study using the InBody 770 found whole-body test-retest reliability scores above 0.999, essentially near-perfect consistency between repeated scans (PMC, 2024). That same study found body fat percentage ran about 4 percentage points lower than DEXA scans on average.
BIA is strongest at tracking your trend over time on the same device, under the same conditions. Absolute numbers may still differ slightly from a DEXA reference scan.
Essential Metrics Decoded: Understanding What Your Body Is Made Of
A single printout can list a dozen numbers. Here's what actually matters.
Skeletal Muscle Mass (SMM) and Functional Strength
Skeletal muscle mass refers to the voluntary muscle you can flex and train, distinct from organ tissue or connective tissue. It plays an outsized role in your health:
- Skeletal muscle handles over 80% of glucose uptake after a meal, making it central to blood sugar regulation (PMC, 2021).
- More muscle supports joint protection, mobility, and resilience against falls as you age.
- During weight loss, the real goal is preserving muscle while losing fat, not just a lower number on the scale. Rapid weight loss without attention to muscle often means losing the very tissue that keeps your metabolism running.
Body Fat Mass vs. Body Fat Percentage
These two numbers tell different stories. Body fat mass is the actual weight of fat on your body, measured in pounds. Body fat percentage is a ratio, fat mass divided by total body weight.
If you gain muscle while losing fat, your body fat percentage can drop even when scale weight stays flat. Track fat mass in pounds alongside the percentage so you can see whether fat tissue is actually coming off—not just whether the ratio shifted.
Visceral Fat Level and Metabolic Risk
Not all fat behaves the same way. Subcutaneous fat sits beneath the skin and is largely cosmetic. Visceral fat wraps around abdominal organs and is metabolically active, releasing inflammatory compounds that drive disease risk.
The MESA study, which used CT imaging on 1,511 participants, found that visceral fat predicted cardiometabolic risk and coronary calcification independent of BMI, while subcutaneous fat was far less predictive (PMC, 2015). Someone can look average-sized and still carry high internal fat.
Most assessment platforms flag a visceral fat level under 10 (or an estimated area under 100 cm²) as a healthy target. Exact cutoffs still vary by device and population.
Segmental Lean Analysis and Musculoskeletal Symmetry
Segmental analysis breaks muscle distribution down by body region: right arm, left arm, trunk, right leg, left leg. This catches things a total-body number never could.
- Identifies unilateral muscle imbalances between limbs
- Flags compensatory movement patterns that may stem from old injuries
- Shows trunk-to-limb ratios that affect posture and core stability
Total Body Water and Fluid Distribution
Water makes up the majority of lean tissue, while fat holds very little. Fat-free mass contains up to 75% water, compared to minimal water content in fat tissue. Tracking intracellular versus extracellular water reveals hydration balance and cellular health that muscle and fat totals miss on their own.

Why One-on-One Interpretation Outperforms a Standalone Scan
Walk up to an unmanned kiosk, step on the platform, and you'll get a printout full of numbers, percentages, and color-coded zones. Most people have no idea what to do with it. It gets folded up, tucked in a bag, and forgotten.
That's the gap one-on-one interpretation closes.
At Enrich Gifts, Dr. Carolyn Johansen reviews InBody 520 results alongside lifestyle factors, including diet patterns, stress load, and sleep quality, to find root causes behind fatigue, metabolic stalls, or inflammation.
A number on a page doesn't explain why visceral fat is elevated or why muscle mass is slipping. A conversation does.
Why this changes the outcome:
- Context replaces confusion. A high ECW/TBW ratio (fluid outside cells vs. total body water) might mean dehydration, overtraining, or something else entirely. A practitioner asks the right follow-up questions to narrow it down.
- Assessments become feedback, not grades. A scan isn't a pass-or-fail report card. It's a snapshot to guide the next decision, not a verdict on your worth or effort.
- Pace gets personalized. Some clients want an intensive overhaul. Others need to move slower for their schedule and biochemistry. Dr. Johansen adjusts recommendations rather than handing out a standardized clinic template.
Who Benefits Most from Personalized Body Composition Testing?
Body composition testing is useful well beyond competitive athletics. It supports people across many life stages and goals.
People pursuing intentional fat loss or GLP-1 therapy. A 2025 joint clinical advisory found that in a major GLP-1 trial, 38% of total weight lost was lean mass, not exclusively fat (PMC, 2025). Monitoring composition during weight loss—not only the scale—helps catch excessive muscle loss early.
Adults over 40 and people navigating hormonal transitions. Muscle mass naturally declines with age, a process called sarcopenia. Tracking trends over time helps flag early muscle loss before it becomes a mobility issue. That matters especially during menopause, when fat distribution and muscle maintenance both shift.
Athletes and people training for strength and function. Segmental lean data helps identify:
- Asymmetries between dominant and non-dominant limbs
- Whether a training block actually built muscle or mostly added water weight
- Trunk stability relative to limb strength for injury prevention
How to Prepare for Your Assessment to Ensure Optimal Accuracy
Results shift based on conditions at the time of testing. A few simple habits make your numbers far more reliable.
Before your appointment:
- Avoid eating for at least 2-3 hours prior to testing; food in the digestive tract skews readings.
- Keep your usual hydration pattern the day before. Don't deliberately over- or under-drink.
- Skip strenuous workouts, sauna sessions, and alcohol for roughly 24 hours beforehand, since all three shift fluid balance.
- Use the restroom shortly before your scan.
For ongoing tracking:
- Test at a consistent time of day, ideally the same time each visit.
- Note where you are in your menstrual cycle if applicable; individual fluid retention can still vary.
- Use the same device for every follow-up scan whenever possible.
A 2018 controlled study of 39 women found no significant difference in BIA-measured body fat or total body water between menstrual phases. Cycle notes still help you interpret your own trends.
Turning Assessment Data into an Actionable Lifestyle and Nutritional Plan
Numbers only matter if they change what you do next. Here's how the data translates into daily decisions.
Protein targets based on lean mass, not total weight. Rather than calculating protein needs from total body weight, use measured lean body mass as the baseline. One 2025 clinical advisory suggests roughly 1.5 grams of protein per kilogram of fat-free mass daily for those on GLP-1 therapy, though researchers note there's no universal consensus on the ideal ratio.
Resistance training aligned with segmental data. If segmental analysis shows a lagging limb or weaker trunk-to-leg ratio, training can target that specific deficit instead of following a generic program.
A realistic reassessment schedule. Follow-up scans every 8 to 12 weeks tend to capture genuine physiological change rather than daily fluctuation noise. This timeframe allows:
- Muscle adaptation from a training program to show up
- Fat loss trends to separate from short-term water shifts
- A natural checkpoint to adjust nutrition or training before the next phase

Frequently Asked Questions
How much does a BIA test cost?
Standalone BIA scans typically range from $50 to $150, depending on the device and location. Packages that include a practitioner consultation and personalized review, like those offered through Enrich Gifts, generally cost more but give you clearer next steps.
What is the most accurate test for body composition?
DEXA scans are considered the clinical reference standard, particularly for bone-related questions. Multi-frequency BIA is slightly less precise in absolute terms but offers excellent repeatability, lower cost, and far more convenience for frequent tracking.
Is body composition testing worth it?
Yes, for most people seeking more than a weight number. Tracking muscle, fat, and hydration trends reveals changes the scale alone cannot show, especially during weight loss, training programs, or hormonal transitions.
How often should you get a one-on-one body composition assessment?
Every 8 to 12 weeks works well for anyone actively working toward a fitness or weight goal. Those in maintenance mode can typically space assessments out to every six months.
Can hydration and meal timing affect my scan results?
Yes. Recent meals, large fluid intake, and electrolyte shifts all temporarily change how electricity moves through your body, skewing results. Following consistent pre-test guidelines keeps your readings comparable over time.
What is the difference between body fat percentage and body fat mass?
Body fat mass is the actual weight of fat on your body, measured in pounds. Body fat percentage is the ratio of that fat weight to your total body weight, expressed as a percentage.