
For many people, these sheets feel overwhelming. Between muscle-fat analysis charts, segmental bars, visceral fat scores, and a composite "InBody Score," it's hard to know where to look first.
This guide walks through a practical reading order:
- Understand how the device measures your body
- Review your major body-composition values
- Check muscle and fat distribution across segments
- Account for testing conditions that can shift results
- Compare trends over time, not single readings
By the end, you'll know which numbers deserve your attention and which need more context before you draw conclusions.
Key Takeaways
- Read your results as a pattern across several measurements, not one isolated score.
- Track trends in skeletal muscle, body fat percentage, visceral fat, and segmental balance based on your goal.
- Hydration, food, exercise, and illness can shift readings — test under consistent conditions.
- Treat your result sheet as a wellness planning tool, not a standalone diagnosis.
What a Body Composition Result Sheet Measures
Your body weight is a mix of fat, muscle, bone, organs, and water, all bundled into one number. A body composition analysis breaks this total apart and estimates how much weight comes from each category. Most result sheets report some combination of:
- Fat mass and body fat percentage
- Lean or fat-free mass (muscle, bone, organs, and water)
- Segmental muscle balance across arms, legs, and torso
- Visceral fat level
- Total body water
Exact categories still depend on your device and report format.
Weight and BMI aren't the same as body composition. BMI is simply your weight divided by your height squared. The CDC describes it as a screening tool that doesn't separate fat from muscle and bone, and doesn't show where fat is located. Two people with the same BMI can have very different compositions. A muscular athlete and a sedentary person of the same height and weight could land on identical BMI numbers despite looking nothing alike.
How bioelectrical impedance analysis works. Devices like InBody use bioelectrical impedance analysis (BIA). A mild electrical current passes through your body, and the device measures impedance (how much resistance that current meets). Muscle and water conduct electricity easily; fat does not. From that pattern, the device estimates your internal composition rather than directly weighing each tissue.
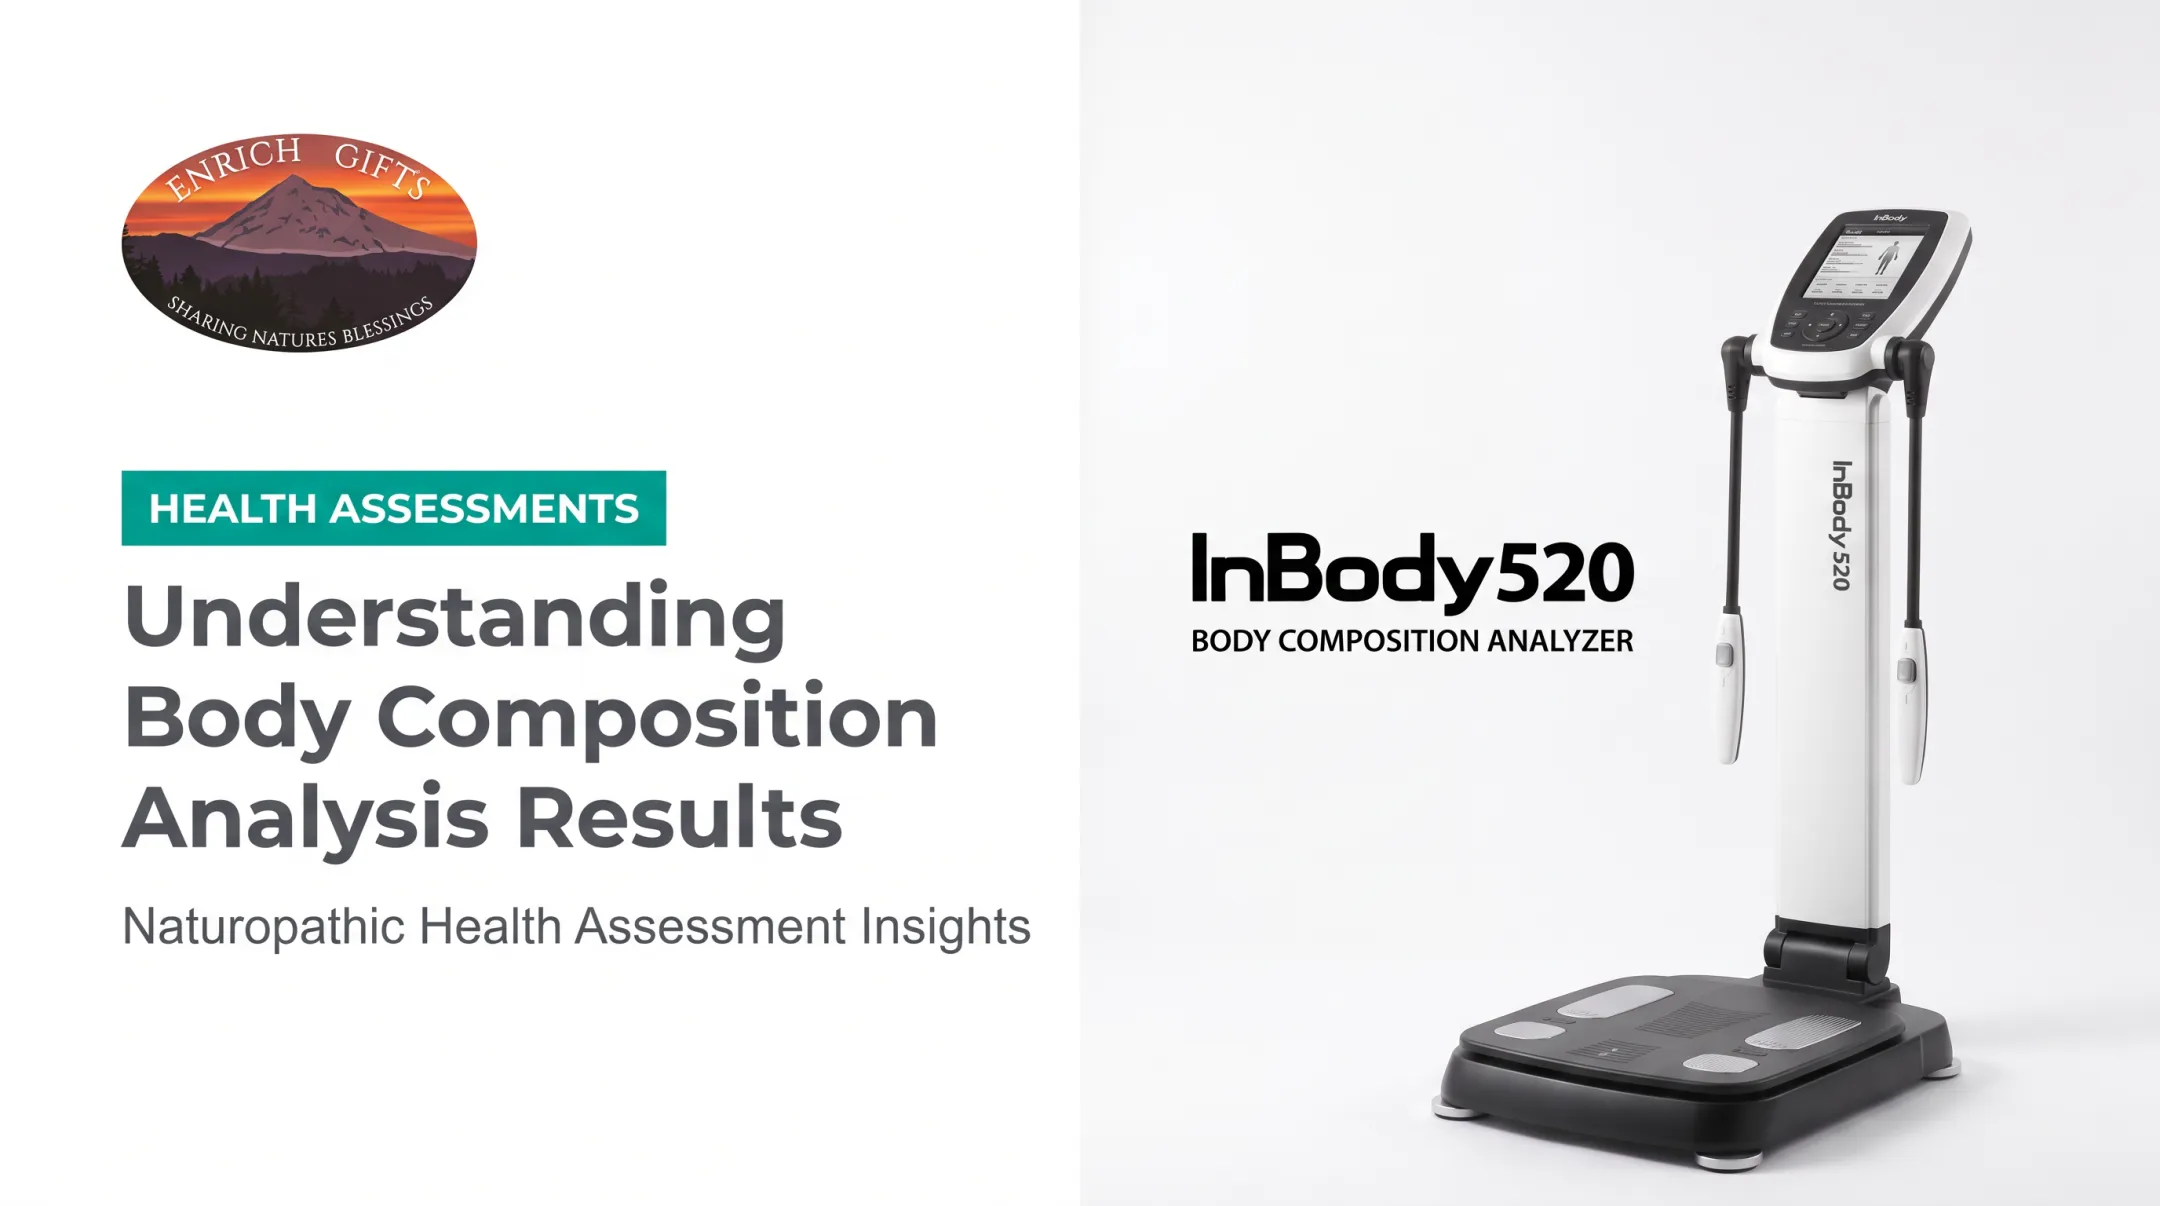
The InBody 520, offered through Enrich Gifts as part of its functional health assessments, uses eight-point tactile electrodes to analyze five body segments independently: both arms, both legs, and the torso. That's why the same scan can show muscle distribution region by region, not just one whole-body estimate.

Reference ranges differ by device model, age, sex, height, and the population data behind each manufacturer's algorithm. A visceral fat score that looks "good" on one device may not translate to another brand's scale. Always use the ranges printed on your own sheet rather than numbers found elsewhere online.
If your results show unexpected values, or you notice symptoms that concern you, bring them to a qualified healthcare professional. A result sheet supports wellness planning; it isn't a diagnostic tool.
How to Read the Main Sections of a Body Composition Result Sheet
Once you understand the measurement method, the next step is learning what each section actually tells you. Most InBody-style reports share a similar layout, even when labels vary slightly by device.
Body weight, BMI, and body fat
Your sheet typically opens with three numbers: body weight, BMI, and body fat. Weight and BMI give broad context, but neither shows whether a change came from fat, muscle, or water.
Body fat mass is the total weight of fat on your body. Percent body fat is that fat mass divided by your total body weight. It tells you what proportion of you is fat, regardless of overall size.
Here's the catch: a lower scale number isn't automatically good news. If most of that drop came from muscle rather than fat, you haven't necessarily improved anything. Goals should focus on the composition of a change, not just its size.
Skeletal muscle, lean mass, and soft lean mass
Three terms get confused constantly:
- Skeletal muscle mass (SMM): muscle attached to your skeleton, the kind you grow through resistance training. It matters for strength, movement, metabolism, and healthy aging.
- Lean mass (fat-free mass): everything that isn't fat: water, organs, connective tissue, bone minerals, and muscle combined. Fat-free mass can contain up to 75% water, so it's not interchangeable with skeletal muscle mass.
- Soft lean mass: generally non-bone, non-fat tissue, though the exact definition varies by device. Check your own report before comparing this figure across machines.
When reviewing trends, look at muscle alongside weight. Stable or rising muscle paired with falling fat usually signals favorable recomposition. Weight loss accompanied by muscle loss is worth a second look at your plan.
Visceral fat and regional fat distribution
Visceral fat sits around your internal organs, deep in the abdomen. Subcutaneous fat sits just beneath the skin, the kind you can pinch. The two behave differently, which is why sheets report them separately.
What counts as a "good" visceral fat reading depends entirely on that device's own scale. Don't borrow a cutoff from a different manufacturer's website and apply it to your results; reference systems aren't standardized across brands.
Regional fat analysis can show where fat tends to concentrate, but it can't diagnose a medical condition on its own.
Segmental lean and fat analysis
Segmental analysis typically breaks your body into five regions: left arm, right arm, trunk, left leg, and right leg. When reviewing this section, watch for:
- Left-to-right muscle differences larger than expected
- Unusually low muscle in one region compared to the rest of your body
- Disproportionately high trunk fat relative to your limbs
Before drawing conclusions, factor in hand dominance, training history, old injuries, and natural body structure. Some asymmetry is completely normal.
If an imbalance is large or persists across multiple scans, talk with a trainer or healthcare provider about technique, rehabilitation, or further evaluation. Don't try correcting it from the sheet alone.

InBody score and supporting values
The InBody Score is a composite, device-specific number, not a universal measure of health or fitness. InBody's own documentation places its standard score range between 70 and 90 points, calculated from the device's fat-control and muscle-control outputs. It's a quick snapshot, nothing more.
Supporting values like basal metabolic rate, total body water, and the extracellular-to-total body water ratio add useful context. None of them should override the main pattern across fat, muscle, and segmental data.
One practical habit: record the report date, device type, and testing conditions every time. That makes future comparisons far more meaningful than a one-off reading.
Accuracy, Testing Conditions, and Comparing Results
Knowing what the numbers mean is only half the equation. The other half is how reliable those numbers are—and what can throw them off.
How accurate are these results?
Body composition analyzers provide estimates, not lab-grade measurements. Accuracy varies by device, the algorithm behind it, your body type, hydration status, and what reference method it's compared against.
A 2024 study published in Frontiers in Nutrition tested the InBody 770 and found very high test-retest reliability for body water and mass taken back-to-back. However, when compared against a clinical reference method, its body fat percentage estimates ran an average of 4 percentage points lower. The device is consistent with itself, but that's different from matching a lab measurement exactly.

For personal progress tracking, that consistency is what matters most. Watching how your numbers move over weeks and months beats treating any single reading as an exact tissue weight.
What can change an InBody result?
Because BIA depends on body water and conductivity, plenty of everyday factors can shift your reading:
- Recent meals, alcohol, or caffeine
- Hydration status, including dehydration or overhydration
- Strenuous exercise or heavy sweating beforehand
- Illness, swelling, or fluid retention
- Bowel or bladder fullness
- Skin temperature
- Menstrual-cycle-related fluid changes
Medications and recent medical procedures affecting fluid balance can influence numbers too. Follow your testing provider's specific instructions rather than guessing at preparation rules.
A simple preparation checklist helps:
- Test at a similar time of day, ideally in the morning
- Keep hydration and meals consistent with your previous test
- Avoid intense exercise right before testing
- Follow the manufacturer's or provider's guidance exactly
At Enrich Gifts, InBody 520 testing is offered through Better You Health and is generally scheduled in the morning, before eating or exercising, so conditions stay consistent between visits.
How to compare two or more sheets
Comparisons only mean something if conditions match. Compare results from the same device, under similar conditions, over a meaningful interval — not a reaction to small day-to-day shifts.
Look for patterns like:
- Fat down, muscle steady — usually a favorable shift
- Muscle up during a planned gain phase — expected if that is the goal
- Muscle and fat both moving the wrong way — worth reviewing with a professional
No single result sheet captures everything. Record waist measurements, strength levels, and energy alongside each scan.
Repeat testing every 2 to 4 weeks gives a clearer picture than testing every few days. Short-term swings are often just water weight.
Which Results Matter Most for Different Goals
Not every number on your sheet deserves equal attention. Which values matter most depends on what you're trying to achieve.
Fat loss
If fat loss is your goal, prioritize:
- Body fat mass and percent body fat over scale weight
- Visceral fat trends
- Waist measurement as a practical cross-check
- Muscle preservation alongside fat reduction
For reference, a waist circumference above 40 inches in men or 34.6 inches in women generally falls into the obese range, making waist a useful cross-check with your scan.
A sustainable plan reduces excess fat without sacrificing skeletal muscle or triggering concerning symptoms. That means solid nutrition, resistance training, regular activity, and adequate sleep—with professional support if symptoms or plateaus persist. Track fat mass, visceral fat, and waist together rather than chasing one calorie target.
Muscle gain or strength development
Focus here shifts to:
- Skeletal muscle mass trends over time
- Segmental lean mass, checked for balanced gains across limbs
- Performance changes: strength, endurance, and recovery
- Nutrition adequacy, particularly protein intake
Meaningful muscle change takes time. Small week-to-week variations often reflect hydration shifts or measurement noise rather than real tissue change, so don't chase a single number. If results stay flat despite consistent training and eating, that's a signal to review your program with a qualified fitness or health professional.
General wellness or healthy aging
For general wellness, priorities broaden to:
- Maintaining functional muscle mass
- Watching for unwanted fat gain over time
- Flagging persistent regional imbalances or unexplained changes
Muscle naturally declines with age in a process called sarcopenia. The NIH notes that resistance and muscle-strengthening activity can help slow this decline, alongside adequate protein intake.
Your result sheet works best with strength testing, mobility checks, sleep quality, and relevant clinical measures. Targets vary by age, sex, medical history, and body structure; one standard does not apply to everyone.
Enrich Gifts assessment and interpretation
At Enrich Gifts in Arlington, Texas, InBody analysis is offered as part of a broader functional health assessment, alongside thermography, OligoScan, and cardiovascular and stress screening. Rather than handing over a printout with a generic interpretation, Dr. Carolyn Johansen, Naturopath, reviews results with each client to discuss what the patterns may suggest about wellness priorities and practical lifestyle strategies.
This naturopathic interpretation is meant to complement, not replace, licensed medical care. If a result or symptom raises a concern needing medical evaluation, that conversation belongs with a licensed physician.
Frequently Asked Questions
How accurate are InBody scan results?
InBody results are estimates shaped by the device model and your testing conditions at the time of the scan. They're highly consistent when repeated back-to-back, so tracking trends over weeks and months is more useful than treating any single reading as exact.
How do I read my InBody test results?
Review body fat, skeletal muscle, visceral fat, and segmental analysis together rather than focusing on weight or the overall score alone. Looking for patterns across these values gives a far more accurate picture than any single number.
What can throw off an InBody scan?
Hydration status, recent food or alcohol, exercise, illness, skin temperature, and inconsistent testing conditions can all shift your results. Testing at a similar time, under similar conditions, keeps comparisons meaningful.
What is a good score on the InBody?
The InBody Score is device-specific, generally falling between 70 and 90 points on the standard scale. It's best interpreted alongside your body fat, muscle mass, age, body structure, and changes over time, not as a stand-alone grade.
What is soft lean mass in the InBody?
Soft lean mass generally refers to non-fat, non-bone tissue, which may include water and organs depending on the device. Confirm the exact definition printed on your own report before comparing it to another machine's results.
What should my segmental fat analysis be?
There's no single ideal distribution that applies to everyone. Compare your results to the reference ranges printed on your own sheet, and discuss any pronounced or persistent regional differences with a qualified professional.